

レッスン10 とレッスン4 をご参照ください。
python + Matplotlib の3D 空間での平面表示は、基本的に「2つの線分の間に膜を貼る」という方法で作ります。
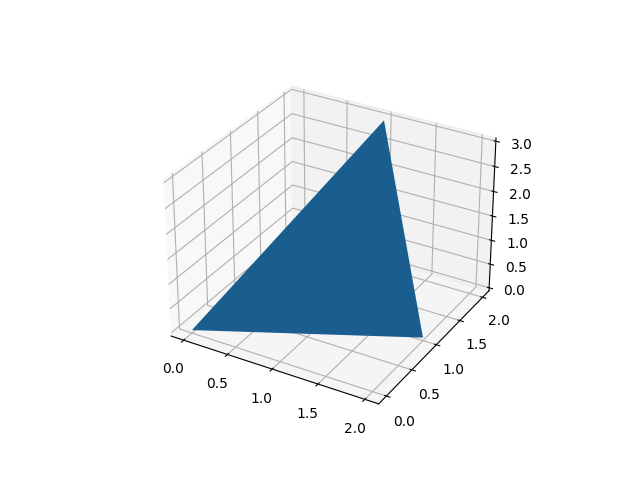
今回のレッスン もその手法を用いますが、2つの線分の端を1点に集中させて三角形にしています。
# python-3D-graphics-step-by-step-11.py    09/04/2023 by Kero
# (11) show a plane in 3D
    # In a fig-window, you can change view point by mouse.
    # See (4)

# Preparation
import numpy as np
import matplotlib.pyplot as plt
from mpl_toolkits.mplot3d import Axes3D

# graph area settings
fig = plt.figure()
ax = fig.add_subplot(111, projection='3d')

# make figure (a bit complicated)
x = np.array([[1, 0],[1, 2]]) # 2重リストの中身はxyzを縦に読む。
y = np.array([[2, 0],[2, 1]]) # 1番目の2重リストは(1,2,3)と
z = np.array([[3, 0],[3, 0]]) # (0,0,0)を結ぶ線分のこと。以下同文。
plane = ax.plot_surface(x, y, z) # 2つの線分が成す面を'surface'で描く。
    # ただし、ax.plot_surface(...)はリストオブジェクトではないので、
    # アニメにするときには[ ]で囲ってオブジェクトにする必要あり。
fig.savefig('python-3D-graphics-step-by-step-11.png')

# show figure
plt.show()
「make figure」 の段落の説明をします。
2つの線分を指定します。16〜18行目をタテに読んでください。
(1, 2, 3)〜(0, 0, 0) と(1, 2, 3)〜(2, 1, 0) の線分です。
この2つの線分でできる面を、’ax.plot_surface(…)’ で作ります。
ファイルへの保存は「壁面」で一括して行うので、’fig.savefig(…)’ で行っています。